Welcome to DU!
The truly grassroots left-of-center political community where regular people, not algorithms, drive the discussions and set the standards.
Join the community:
Create a free account
Support DU (and get rid of ads!):
Become a Star Member
Latest Breaking News
Editorials & Other Articles
General Discussion
The DU Lounge
All Forums
Issue Forums
Culture Forums
Alliance Forums
Region Forums
Support Forums
Help & Search
S&P 500 closed Wednesday 11/5 at 6796, up 0.4% # ADP private payrolls higher than expected # Shutdown longest in history [View all]
This discussion thread is pinned.
Last edited Wed Nov 5, 2025, 07:22 PM - Edit history (200)
In the future I will only be doing these twice a week: Tuesday and Friday, unless it's really interesting.10 Year TREASURY YIELD 4.16%, up 0.07 (about 2 weeks ago it fell to 3.98, its lowest point since April. Dunno what's caused the surge in general, Wednesday's surge came from brightened economic outlook resulting from the +42,000 ADP jobs report).
https://finance.yahoo.com/quote/%5ETNX/
Bitcoin: up 2.7% to $103,961 as risk-on mood grows
Market news of the day, Wednesday: https://finance.yahoo.com/
https://finance.yahoo.com/news/live/stock-market-today-dow-sp-500-nasdaq-rise-as-tech-rebounds-supreme-court-questions-trump-tariffs-210033658.html
Scroll down to see earlier in the day reports
No Summary Today, see above link for Yahoo Financial's Summary. But here's some info about Wednesday's ADP report
The ADP private sector payroll jobs report came out today, Wednesday at +42,000 private sector jobs for October, much more than expected. Still a very sad number compared to historic averages, but the media seems to only care about whether a report is better or worse than expected. That's the world we live in.
ADP is NOT a government agency, so knock off the Krasnov, Krasnov!! crap for once. They are a private data payroll processor. (Yes, I know they are an evil corporation).
Also know that they process payrolls for only about 20% of the private sector workforce. As for how they project the other 80% from their data, I don't know -- https://www.democraticunderground.com/10143489467#post4
See https://www.democraticunderground.com/?com=view_post&forum=1014&pid=3506135 for a month-by-month comparison of ADP's private sector payroll numbers with the Bureau of Labor Statistic's equivalent numbers (through July 2025)
Coming up, non-government reports:
UMich Consumer sentiment (prelim) - Friday
THE BELOW HAS NOT BEEN UPDATED, The BELOW ARE STILL THE TUESDAY 11/4 CLOSE NUMBERS
=============================================
The S&P 500 closed Tuesday November 4 at 6772, down 1.2% for the day,
and up 17.1% from the 5783 election day closing level,
and up 12.9% from the inauguration eve closing level,
and up 15.1% year-to-date (since the December 31 close)
S&P 500
# Election day close (11/5/24) 5783
# Last close before inauguration day: (1/17/25): 5997
# 2024 year-end close (12/31/24): 5882
# Trump II era low point (going all the way back to election day Nov5): 4983 on April 8
# Several market indexes: https://finance.yahoo.com/
# S&P 500: https://finance.yahoo.com/quote/%5EGSPC/
https://finance.yahoo.com/quote/%5EGSPC/history/
========================================================
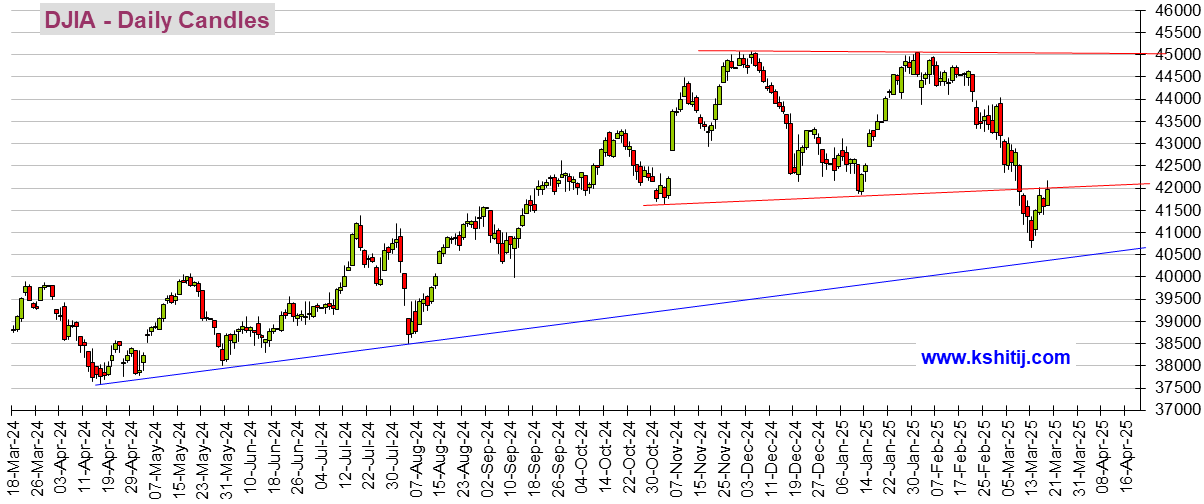
I'm not a fan of the DOW as it is a cherry-picked collection of just 30 stocks that are price-weighted, which is silly. It's as asinine as judging consumer price inflation by picking 30 blue chip consumer items, and weighting them according to their prices. But since there is an automatically updating embedded graphic, here it is. It takes several, like 6 hours, after the close for it to update, like about 10 PM EDT.
(If it still isn't updated, try right-clicking on it and opening in a new tab. #OR# click on https://finance.yahoo.com/quote/%5EDJI/ ).
The Dow closed Monday at 47,337, and it closed Tuesday at 47,085, a drop of 0.5% (251 points) for the day
I don't maintain statistics for the DOW like percent up or down since election day, or year-to-date, or from the all-time high etc. like I do for the S&P 500.
https://finance.yahoo.com/
DOW: https://finance.yahoo.com/quote/%5EDJI/
. . . . . . https://finance.yahoo.com/quote/%5EDJI/history/
DOW
# Election day close (11/5/24) 42,222
# Last close before inauguration day: (1/17/25): 43,488
# 2024 year-end close (12/31/24): 42,544
DJIA means Dow Jones Industrials Average. It takes about 6 hours after the close to update, so check it after 10 PM EDT. Sometimes it takes a couple days (sigh)

I don't have an embeddable graph for the S&P 500, unfortunately, but to see its graph, click on https://finance.yahoo.com/quote/%5EGSPC/
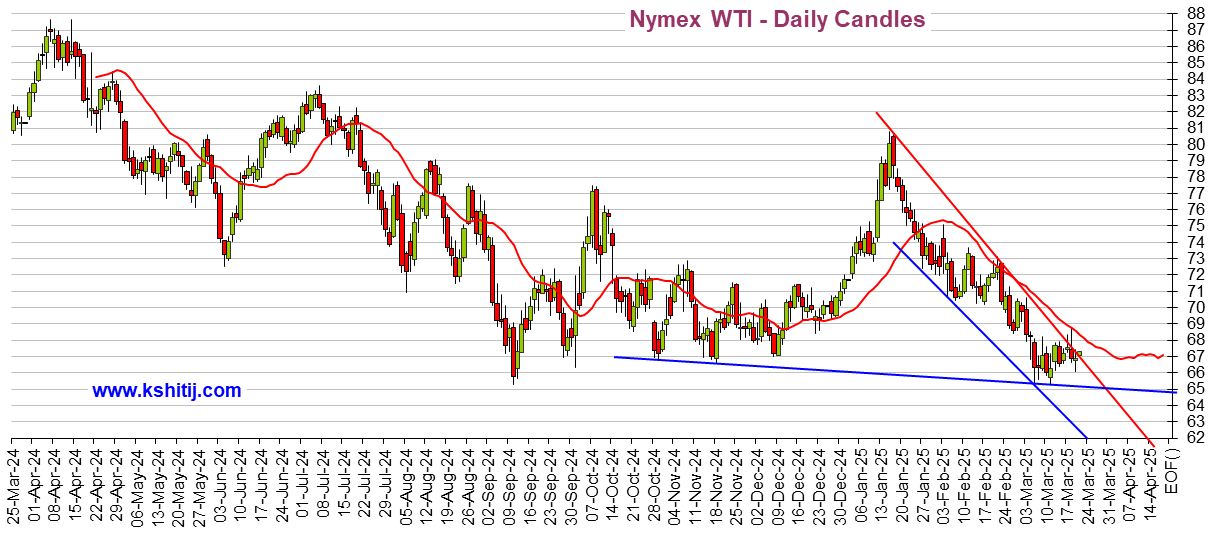
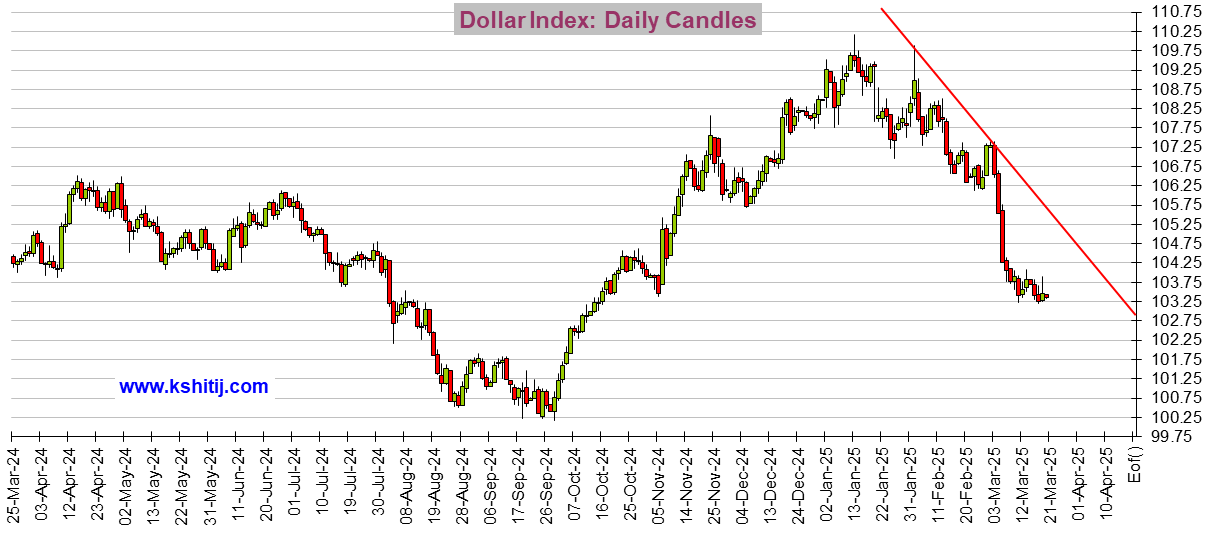
While I'm at it, I might as well show Oil and the Dollar:
Crude Oil

US Dollar Index (DX-Y.NYB)

If you see a tiny graphics square above and no graph, right click on the square and choose "load image". There should be a total of 3 graphs. And remember that it typically takes about 6 hours after the close before these graphs update.
🚨 ❤️ 😬! < - - emoticon library for future uses
15 replies
 = new reply since forum marked as read
Highlight:
NoneDon't highlight anything
5 newestHighlight 5 most recent replies
S&P 500 closed Wednesday 11/5 at 6796, up 0.4% # ADP private payrolls higher than expected # Shutdown longest in history [View all]
progree
Mar 2025
OP
Kicking for the milestone update - S&P 500's first close below the election day close. How major indexes fared:
progree
Mar 2025
#1
Kicking: update for Thurs. March 6 close. The "Trump Trade" is back underwater after losing 1.8% for the day (S&P 500)
progree
Mar 2025
#2
Kicking: Update: S&P 500 closed Friday at 5770, up 0.5% for the day but still below the election day close
progree
Mar 2025
#3
Update: S&P 500 closed Monday 3/10 at 5615, down 2.7% for the day and 2.9% below the election day close
progree
Mar 2025
#4
Update: S&P 500 closed Tuesday 3/11 at 5572, down 0.8% for the day, briefly fell into correction territory
progree
Mar 2025
#5
S&P 500 closed Wednesday 3/12 at 5599, up 0.5% for the day, but down 3.2% since election day
progree
Mar 2025
#6
Update: S&P 500 closed Thursday at 5522, down 1.4% for the day, and MORE THAN 10% down from the all-time high
progree
Mar 2025
#7
Update: S&P 500 closed Friday at 5639, up 2.1% for the day, and down 2.5% since election day
progree
Mar 2025
#8
Update: S&P 500 closed Monday at 5675, up 0.6% for the day, and down 1.9% since election day
progree
Mar 2025
#9
Update: S&P 500 closed Tuesday at 5615, down 1.1% for the day, and down 2.9% since election day
progree
Mar 2025
#10
S&P 500 closed Tuesday 3/25 at 5777, up 0.2% for the day, down 0.1% since election day, down 6.0% from ATH
progree
Mar 2025
#11